


Exploring Top Analyst Skills & Tools in Texas ☀️
- Kacie Julie Coahran Scott

- Mar 27
- 8 min read
Recently, I embarked on a deep dive into Data Analyst job trends in Texas, analyzing 100 job listings — 50 from my personal applications and 50 sourced from LinkedIn, Indeed, the Data Analyst Job Board, and Google Job Search.
My Goal? To uncover the trending skills and tools that employers prioritize for their ideal candidate. Let’s explore these findings and uncover what it takes to thrive in the ever-evolving field of data analytics.
The Looming AI Question: Is this Buzz word vital?
Let's first tackle Artificial Intelligence, a word that is buzzing around the technology realm! With all this hype I was curious how prevalent it was in the job description.

Here's the Breakdown:
88 out of 100 applications: Made absolutely no mention of AI.
12 applications: Required machine learning and modeling skills, typically associated with senior roles or positions specifically focused on AI training.
While AI is undoubtedly transforming industries, it's not yet a universal requirement for data analyst roles in Texas. The "magical hype" is real in certain niche areas, but core data analysis skills remain paramount. I believe using AI to enhance your workday by it being a collaborative tool is extremely useful for small repetitive tasks like drafting outlines or emailing coworkers. I am sure as I grow into the data realm I will find innovative and unique ways a data analyst could be using Artificial Intelligence!
Examining Education in Job Applications
When looking at qualifications, the data shows a clear preference for educational backgrounds. A significant 81% of job listings required a Bachelor’s degree, whereas only 12% were open to candidates with only a high school diploma. Notably, 5 listings sought candidates with a PhD for specialized roles, while just 2 asked for an Associate degree. This trend clearly indicates that higher education is highly valued in the data analytics field.

We gotta talk about Internships....
When it comes to internships, most listings specify eligibility only for graduate students or recent university graduates. This can be disheartening for self-taught learners or those who have completed rigorous analyst programs such as Springboard, AnalystBuilder, or Google Data Analytics. These programs equip candidates with hands-on skills and real-world project experience, yet many companies overlook these talented individuals due to traditional education biases.
Also it's worth considering that not everyone can afford a college education, especially in today’s economy. Many aspiring analysts turn to affordable, high-quality online programs to build their skills and break into the field. By adhering to strict degree requirements, companies may be overlooking exceptional candidates who don’t fit the traditional mold of sticking to the status quo.
Let's dive into the buffet of skills that companies are craving! 🍽️
To get a clearer picture, I categorized the most frequently mentioned skills and tools into logical groups. It felt fitting to also explain the tool and it's usage in the Data World. Enjoy!
Programming Languages: SQL reigned supreme, followed by Python and R. JavaScript/HTML and VBA were less common.
Automation Tools: A general category, with 17 mentions.
SQL (Appeared in 51 Applications)
→ Definition: Structured Query Language used to manage and query relational databases.
→ Usage: Analysts use SQL to extract, manipulate, and analyze large datasets, often joining multiple tables to uncover patterns.
Python (Appeared in 24 Applications)
→ Definition: A programming language widely used in data analysis and machine learning.
→ Usage: Analysts use Python for data wrangling, statistical analysis, and creating predictive models.
R (Appeared in 23 Applications)
→ Definition: A programming language and software environment for statistical computing and graphics.
→ Usage: Analysts use R for complex statistical analysis and data visualization, often preferred in academic and research settings.
JS/HTML (Appeared in 4 Applications)
→ Definition: JavaScript and HTML, core web technologies for building dynamic websites.
→ Usage: Analysts familiar with these technologies can create interactive visualizations and web-based reports.
Automation Tools (Appeared in 17 Applications)
→ Definition: Software or scripts that automate repetitive tasks.
→ Usage: Analysts use automation to streamline data pipelines, ETL processes, and reporting.
VBA (MS) (Appeared in 5 Applications)
→ Definition: Visual Basic for Applications, a programming language for automating tasks in Excel and other MS Office products.
→ Usage: Analysts use VBA to automate repetitive processes in Excel and streamline data tasks.
Data Visualization Tools: Tableau led the pack, followed by Power BI and Looker. “Data Visuals” was mentioned 17 times with no specific tool mentioned.
Tableau (Appeared in 29 Applications)
→ Definition: A data visualization tool that helps create interactive dashboards and reports.
→ Usage: Analysts use Tableau to build visual insights that communicate data trends to business teams.
Power BI (Appeared in 23 Applications)
→ Definition: A business analytics tool used to create interactive dashboards.
→ Usage: Analysts use Power BI to visualize data and build automated reports for decision-makers.
Looker (Appeared in 13 Applications)
→ Definition: A cloud-based data exploration and visualization platform.
→ Usage: Analysts use Looker to build and share real-time dashboards and data models.
Data Visualization (Appeared in 17 Applications)
→ Definition: The graphical representation of data to identify patterns and insights.
→ Usage: Analysts use tools like Tableau, Power BI, and Looker to build interactive dashboards that tell data stories. These applications did not specify the specific tool used.
Cognos (Appeared in 2 Applications)
→ Definition: An IBM business intelligence tool.
→ Usage: Analysts use Cognos to build dashboards, reports, and data models
Microsoft Office Suite: A staple! Excel dominated (63 mentions), with Word and PowerPoint also frequently listed.
MS Excel (Appeared in 63 Applications)
→ Definition: A spreadsheet program used for data analysis, visualization, and modeling.
→ Usage: Analysts leverage Excel for data cleaning, pivot tables, VLOOKUPs, and creating dashboards to summarize key insights.
MS Word (Appeared in 45 Applications)
→ Definition: A word processing tool for creating documents.
→ Usage: Analysts use Word to document findings, write reports, and summarize project insights for stakeholders/clients/business owners.
MS PowerPoint (Appeared in 25 Applications)
→ Definition: A presentation software used to create slide decks.
→ Usage: Analysts use PowerPoint to present analytical findings to leadership in an engaging and visual format.
MS Visio (Appeared in 5 Applications)
→ Definition: A diagramming tool used for creating flowcharts and process maps.
→ Usage: Analysts use Visio to map workflows and visualize data processes.
MS SharePoint (Appeared in 3 Applications)
→ Definition: A collaboration and document management platform.
→ Usage: Analysts use SharePoint to store, organize, and share project documentation.
Data Management: Cloud platforms like Snowflake, AWS, and Azure were present, along with traditional tools like SAS and MS Access. ETL processes were also noted.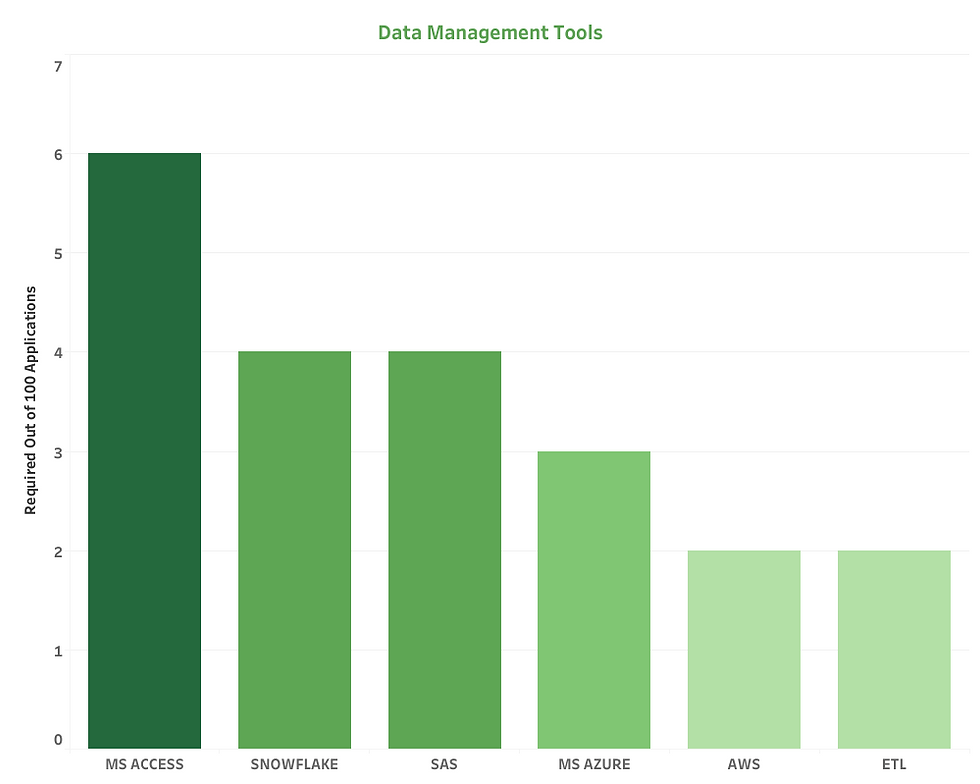
Access (MS) (Appeared in 6 Applications)
→ Definition: A database management system used for storing and managing data.
→ Usage: Analysts use Access for building and managing small-to-medium databases.
Snowflake (Appeared in 4 Applications)
→ Definition: A cloud-based data warehousing platform.
→ Usage: Analysts use Snowflake to store, query, and analyze large datasets efficiently.
Azure (MS) (Appeared in 3 Applications)
→ Definition: A cloud computing platform from Microsoft.
→ Usage: Analysts use Azure for data storage, analysis, and cloud-based applications.
SAS (Appeared in 4 Applications)
→ Definition: A statistical analysis tool commonly used in enterprise environments.
→ Usage: Analysts use SAS for data manipulation, statistical modeling, and advanced analytics.
AWS (Appeared in 2 Applications)
→ Definition: Amazon Web Services, a cloud computing platform.
→ Usage: Analysts use AWS for cloud storage, computing, and machine learning tasks.
ETL (Appeared in 2 Applications)
→ Definition: Extract, Transform, Load — a process for moving data between systems.
→ Usage: Analysts use ETL tools to clean and prepare data for analysis.
Data Science and Analytics: Statistics, A/B testing, and Dataiku were included, highlighting the need for strong analytical foundations.
Statistics (Appeared in 21 Applications)
→ Definition: The practice of collecting, analyzing, interpreting, and presenting data.
→ Usage: Analysts apply statistical techniques to identify trends, test hypotheses, and make data-driven decisions.
ML/AI (Appeared in 12 Applications)
→ Definition: Machine Learning (ML) and Artificial Intelligence (AI) techniques that enable systems to learn from data.
→ Usage: Analysts apply ML/AI models to predict outcomes, automate processes, and improve decision-making.
A/B Testing (Appeared in 7 Applications)
→ Definition: A method to compare two versions of a product or process to determine which performs better.
→ Usage: Analysts use A/B testing to optimize websites, marketing campaigns, and product features.
Dataiku (Appeared in 2 Applications)
→ Definition: A data science platform for building ML models and analyzing large datasets.
→ Usage: Analysts use Dataiku to streamline and automate data workflows.
Business and Project Management: Salesforce, Workday, Jira, Agile/Waterfall/SCRUM, and UAT were among the mentioned skills, indicating the importance of understanding business processes.
Salesforce (Appeared in 9 Applications)
→ Definition: A customer relationship management (CRM) platform.
→ Usage: Analysts use Salesforce to analyze sales, marketing, and customer data to improve business performance.
Workday (Appeared in 8 Applications)
→ Definition: An enterprise resource planning (ERP) software for managing HR and financial processes.
→ Usage: Workday too helps analyze workforce data and streamline HR processes.
Agile & Waterfall (Appeared in 6 Applications)
→ Definition: Project management methodologies used to plan and execute projects.
→ Usage: Analysts participate in Agile or Waterfall workflows to ensure smooth project delivery.
JIRA (Appeared in 4 Applications)
→ Definition: A project management tool used for Agile workflows.
→ Usage: Analysts track and manage tasks, bugs, and project progress using JIRA.
Stream Mapping (Appeared in 4 Applications)
→ Definition: A visual tool used to analyze and optimize processes.
→ Usage: Analysts use stream mapping to identify bottlenecks and improve efficiency.
UAT (Appeared in 3 Applications)
→ Definition: User Acceptance Testing, the final phase of testing software before deployment.
→ Usage: Analysts participate in UAT to ensure data solutions meet user requirements.
ERP Systems (Appeared in 3 Applications)
→ Definition: Enterprise Resource Planning systems that manage business processes.
→ Usage: Analysts use ERP data to analyze operational performance and identify opportunities for improvement.
Smartsheet (Appeared in 2 Applications)
→ Definition: A cloud-based project management and collaboration tool.
→ Usage: Analysts use Smartsheet to manage data collection and project timelines.
Alchemer (Appeared in 2 Applications)
→ Definition: A survey and feedback platform.
→ Usage: Analysts use Alchemer to gather and analyze customer insights.
HRIS Software (Appeared in 2 Applications)
→ Definition: Human Resources Information Systems for managing employee data.
→ Usage: Analysts use HRIS systems to analyze workforce trends and performance.
Which skills should aspiring data analysts concentrate on?
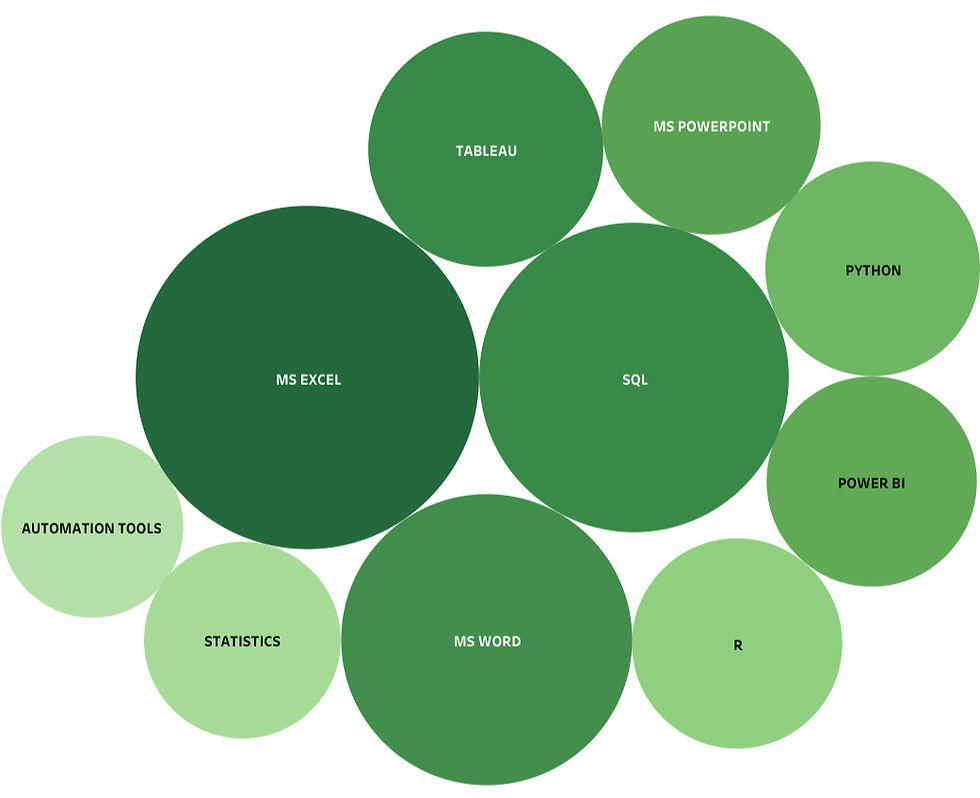
The Top Requested Skills or Tools.... (Drumroll)
MS Excel - Dominated as the top skill, highlighting how in Texas this is the go-to data tool
SQL - Number 2 skill, showing an importance of querying databases and managing data
MS Word - Simple, yet needed when conveying findings or crafting reports
Tableau - Leading Visual tool in Texas, helpful in creating impactful data imagery
MS Power Point - the perfect tool to display your insights to stakeholders or clients
Python or R - important programming languages to assist in data analysis
Statistics - understanding these concepts will help assess data trends accurately
Power BI - another data visualization tool to draft visuals and dashboards
Automation Tools - lastly understand how you can enhance efficiency appears to be an important attractive skill for employers
Final Thoughts
My analysis of 100 job applications reveals key insights into the most sought-after skills and tools for data analysts in Texas. Proficiency in Microsoft programs is essential, with SQL, Tableau, and a strong foundation in statistics also taking center stage. While AI and machine learning are gaining traction, most entry-level positions still prioritize traditional data manipulation and visualization skills.
For those aspiring to break into the data analytics field, mastering these core tools will greatly enhance your chances in a competitive job market. As for me, I’ll continue to upskill and stay ready to tackle the next emerging tool!
Cheers and Have a wonderful rest of your week!🚀


Comments