


👽“Beam Me Up, Data”
- Kacie Julie Coahran Scott

- May 26
- 14 min read
An Alien Analysis by Kacie Scott | 5.19.2025
INTRODUCTION
Overview of this Analysis?
My name is Kacie Scott, Alien Analyst for the Cosmic Curiosity Coalition (CCC). I’ve been officially tasked with investigating a curious dataset of alien encounters from 2000 - 2025, generously provided by Ian Klosowicz, the Curator of Cosmic Oddities. My mission? To probe the data for patterns, anomalies, and interstellar insights. In addition to identifying trends, I've also been requested by Curator Ian to visualize the information in a dashboard. Here are the high priority questions required:
→ Which countries or regions report the most alien activity?
→ Are certain UFO types more likely to trigger a military or government response?
→ Is there a connection between weather or time of day and the frequency of sightings?
→ Which UFO encounters went viral, and what factors contributed to that?
→ Are anomalies more likely to be detected in certain conditions?
→ Which locations have the highest concentration of “Classified” responses?
→ What patterns emerge when analyzing by season or date range?
As the Lead Analyst for CCC, I aim to bring clarity to the chaos and hopefully uncover the secrets of the stars.
Where is the Data Stored & What is the Data?
Stored as a CSV file in Analyst Hive, titled: Alien_Activity_Observations.
Contains 4000 recorded alien encounters, with 13 columns with string, date, integer, boolean data types:
→ Date, Country, Region of the sighting
→ Alien species type
→ Duration of encounter with the number of witnesses
→ Detection of anomalies
→ Weather and time of day
→ Presence of military response or media coverage
→ Government response classification
Is the Dataset Credible? (Using ROCCC System to Review Integrity)
Is it Reliable: Partially, structured and formatted in CSV format, but manually created and not from a verified scientific source. Due to its fictional nature, the data is limited in reliability.
Is it Original: Yes, created by Ian Klosowicz who took creative liberty in inventing an alien encounter dataset.
Is it Comprehensive - Partially, contains 13 columns and 4000 rows. While this offers a decent foundation, it's a relatively small dataset with room for expansion for deeper investigation.
Is it Current: Yes, includes sightings up to 5/13/2025, reflective of ongoing fictional activity.
Is it Cited: No, the dataset is not linked to any sources outside of Ian’s imagination.
PROCESS & ANALYZE
Chosen Tools?
Google Sheets, BigQuery, Tableau and Canva
Reviewing the Data:
🌍 Countries Represented? There are 195 countries in the world however the alien encounters are only focused in these 10 countries: Australia, Brazil, Canada, China, India, Mexico, Russia, South Africa, United Kingdom, and United States of America. Here’s a memo from Curator Ian who explains why:
Internal Memo from Ian KlosowiczCurator of Cosmic Oddities | Cosmic Curiosity Coalition (CCC)Subject: Geographic Scope of Alien Encounter DatasetThank you for spearheading this Alien Analysis Mission. Before diving too deep into the anomaly vortex, I wanted to provide context on why the dataset only includes 10 countries! The Cosmic Curiosity Coalition (CCC) has a partnership with the Global Extraterrestrial Reporting Alliance (GERA) which only has data-sharing agreements with the following 10 nations as of 2025. These countries were chosen to maintain geographic distribution to ensure global representation in all continents. Please note that other countries may be experiencing alien activity however due to politics, data privacy, and cosmic censorship— we do not have access to these encounters for now. Let me know if you have any additional questions!🛸 7 UFO Types: Triangle, Light, Disk, Orb, Sphere, Cigar, and Unknown. Here’s a breakdown:
Triangle: Quiet sleek aircraft with sharp edges and 3-4 glowing points
Light: Brilliant orbs of pulsing energy that appear in clusters
Disk: Classic flying saucer that is metallic, spinning, and hovering
Orb: Small floating transparent spheres, sometimes having a colorful hue
Sphere: Larger and more solid orb that emit strange hums
Cigar: Long cylindrical crafts seen at high altitudes
Unknown: unclassified shape shifting forms that defy categorization
👀 Witness Count: reports include between 0 and 12 witnesses per encounter.
🕜 Duration of Sighting: encounter durations range from 0 to 156 minutes, reflecting everything from fleeting blips to extended observations.
🌦️ Weather Conditions: at the time of each event it was either Snowy, Clear, Cloudy, Stormy, Rainy, or Foggy.
🌗 Time of Day Categories: Dawn, Day, Dusk, Night.
📺 Media Coverage Categories: None, Local, National, Viral.
🕵️ Government Response Levels: None, Observed, Investigated, and Classified.
Answering the Questions?
→ Starting with the first question: Which countries or regions report the most alien activity?
COUNTRY | Canada | China | India | USA | Russia | Mexico | Australia | Brazil | South Africa | UK |
ENCOUNTERS | 417 | 412 | 411 | 409 | 401 | 400 | 399 | 388 | 382 | 381 |
COUNTRY % | 10.43% | 10.30% | 10.28% | 10.23% | 10.00% | 9.98% | 9.70% | 9.55% | 10.03% | 9.53% |
SELECT COUNT(country)
FROM `my-first-project-2024-434615.Alien_Encounters.Sightings`
WHERE country = "UK" #Queried Each Country for the Encounter Totals
To answer the first question, I used BigQuery to calculate the total sightings by country. Canada leads the pack with 417 reported alien sightings, followed closely by China (412) and India (411). Overall, the distribution is fairly even across all 10 countries—the United Kingdom has the lowest total at 381, making the difference between the highest and lowest only 36 sightings. But when we zoom in on regional patterns, more interesting trends emerge.
COUNTRY | TOP REGION | ENCOUNTERS | COUNTRY % | LOW REGION |
Canada | Central | 95 | 22.78% | North |
China | Tie: East/West | 90 (Each) | 21.84% | North |
India | West | 88 | 21.41% | East |
USA | Central | 93 | 22.74% | West |
Russia | West | 85 | 21.20% | North |
Mexico | East | 92 | 23.00% | South |
Australia | East | 91 | 22.81% | West |
Brazil | South | 99 | 25.52% | Central |
South Africa | North | 90 | 23.56% | West |
UK | West | 94 | 24.67% | South |
Used this SQL in BigQuery to pull the information above:
SELECT COUNT(region)
FROM `my-analysis.Alien_Encounters.Sightings`
WHERE region = "East"
#Queried North, East, South, West, Central for Encounter Totals
SELECT country, region,
COUNT(*) AS region_count,
RANK() OVER (PARTITION BY country ORDER BY COUNT(*) DESC) AS region_rank,
FROM `my-analysis.Alien_Encounters.Sightings`
GROUP BY country, region
ORDER BY country;
#Queried the Rankings of Region by Country to gather intel on Top and Low Regions
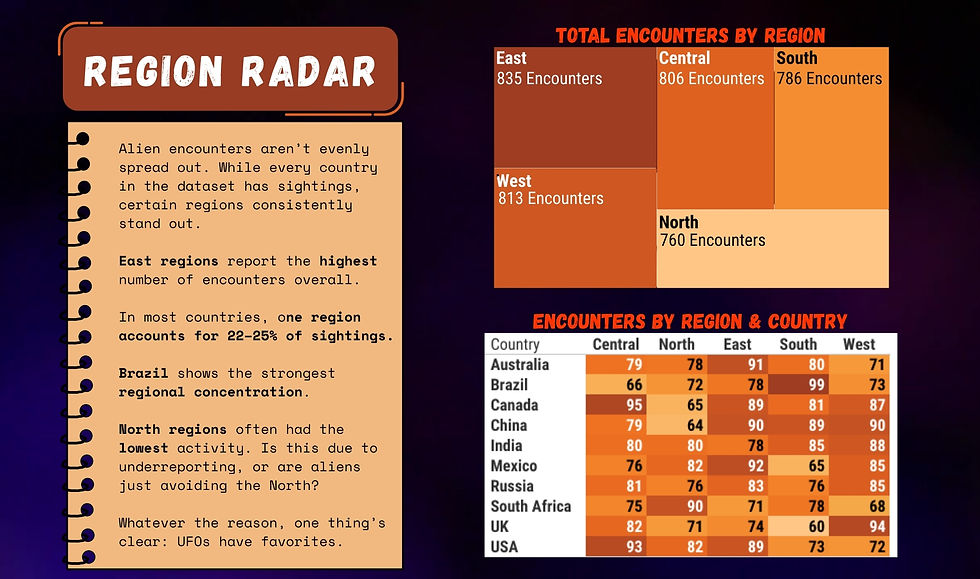
On average 22–25% of a country’s sightings occur in a single dominant region. While Central regions take the lead in North America (Canada and the U.S.), there’s no single region that dominates globally. Brazil has the strongest regional concentration, with the South region accounting for 25.5% of all its sightings. China had a unique outcome: a perfect tie between East and West regions, each representing 21.8% of total sightings.
When examining the least active regions, North appears most frequently at the bottom—particularly in Canada, Russia, and China. This contrast raises some intriguing possibilities: Are these regions underreporting encounters, or are alien visitors truly avoiding them? Either way, it begs the question...why are aliens steering clear of the North? For future analysis, focusing on underrepresented regions may uncover new patterns or gaps in reporting.
→ Are certain UFO types more likely to trigger a military or government response?
To understand this question, I needed to know how many types of UFOs are in this csv file. Using SQL I found 7 types. After that I gathered military responses for each alien in Google Sheets.
SELECT DISTINCT(ufo_type)
FROM `my-analysis.Alien_Encounters.Sightings`
SELECT ufo_type,
COUNTIF(military_response = TRUE) AS military_response_yes,
COUNTIF(military_response = FALSE) AS military_response_no
FROM `my-analysis.Alien_Encounters.Sightings`
GROUP BY ufo_type
ORDER BY military_response_yes DESC;
#COUNTIF used to tally Military Response vs Querying Each
ufo_type | Cigar | Disk | Light | Orb | Sphere | Triangle | Unknown |
YES | 282 | 277 | 327 | 280 | 267 | 267 | 262 |
NO | 288 | 292 | 288 | 296 | 297 | 297 | 280 |
We can see from the data that Light-type UFOs trigger military responses most often, with 327 confirmed responses. The lowest response count is tied between Sphere and Triangle types, both at 267. Overall, the response rates are fairly evenly distributed across all UFO types—differing by only about 60 responses between the highest and lowest.
→ Which locations have the highest concentration of “Classified” responses?
→ Additional Questions: Does government vs. military response vary? What does response activity look like by weekday?
To answer this question I want to look at Military response and Government response to see trends, patterns, and if anything is overlapping or unique.
Military involvement in encounters is nearly evenly split, with 1962 of the 4000 total sightings receiving a response. However, the follow-through from government agencies varies significantly. A large portion of sightings (1599 cases) are recorded with no government response at all, while another 1,180 are merely marked as Observed, suggesting minimal engagement. More serious actions are less frequent, with 779 cases officially investigated and only 442 classified, reflecting a high bar for deeper involvement. Interestingly, military and government responses don’t always align. In 376 instances, the military responded to a sighting, but no government-level classification followed. Conversely, 124 sightings were classified at the government level without any military response, raising questions about internal protocols, cross-agency communication, or the nature of those specific encounters. Big sighs, is this due to a silo, are departments not conversing - for future analysis perhaps we push for consistency across the board?
When it comes to the type of UFO involved, Light-type sightings receive the most military attention (327), followed by Cigar and Disk shapes. Interestingly the Unknown UFOs—those that defy categorization—receive less military response (262) than more familiar forms, perhaps due to their unpredictable nature or lack of consistent features. Overall, the military seems to treat most UFO types with equal seriousness, showing a relatively balanced distribution of response across the board. Together, these patterns suggest that while the military acts swiftly in many cases, the escalation to formal government investigation or classification is far more selective—and at times, inconsistent. Another curious detail emerges when you consider the overlap between viral sightings and classified cases. While you'd expect top-secret encounters to stay out of the public eye, some of the very sightings that made headlines were also marked as “Classified” at the government level. That begs the question: How are these stories getting out? Is there a man on the inside leaking stories? The Cosmic Curiosity Coalition (CCC) needs to consider opening an internal investigation!
When you break down government response by country, some unexpected patterns emerge. Mexico leads with 55 classified or investigated cases, followed closely by China (53) and Canada (50).
SELECT FORMAT_DATE('%A', DATE(date)) AS weekday,
COUNT(*) AS total_government_responses
FROM `my-analysis.Alien_Encounters.Sightings`
WHERE government_response_level IN ("Observed", "Investigated", "Classified")
GROUP BY weekday
#Understanding Government response by Weekday (excluding None)
SELECT FORMAT_DATE('%A', DATE(date)) AS weekday,
COUNT(*) AS military_response_count
FROM `my-analysis.Alien_Encounters.Sightings`
WHERE military_response = TRUE
GROUP BY weekday
#Understanding Military response by Weekday
These queries above helped verify my Tableau visuals. What did I find? Wednesday and Saturday stood out as the most active days for both military and government responses. Military peaked on Wednesday (306) and Saturday (304). Government responses also hit their highs on Saturday (372) and Wednesday (371). Could be a coincidence—or maybe aliens like to show up midweek and on the weekend. Either way, those days seem to spark the most attention from Earth’s responders.
→Is there a connection between weather or time of day and the frequency of sightings?
SELECT weather_condition,time_of_day, COUNT(*) AS total_sightings
FROM `my-first-project-2024-434615.Alien_Encounters.Sitings`
GROUP BY weather_condition, time_of_day
ORDER BY total_sightings DESC;
#Queried to uncover the Weather & Time of Day Patterns
I used BigQuery to explore how weather and time of day might influence when alien sightings are most frequently reported. The results offer intriguing insight into when aliens seem to feel most comfortable making an appearance.
Based on the data, Stormy weather during the Day resulted in the highest number of recorded UFO encounters (188), suggesting that turbulent conditions might draw more sightings—or attention.
Interestingly, Clear conditions at Night and Dusk were also among the top reported, each with 182 encounters, reinforcing the idea that visibility may influence reporting rates. Dawn shows notable activity across multiple weather types, including Cloudy, Rainy, and Clear, all ranking high.
On the other end, the least common condition was Snowy during the Day, with only 141 sightings, followed closely by Snowy at Dusk and Foggy at Dusk. These lower frequencies could indicate limited visibility or fewer observers during those times. Overall, the data suggests a balanced mix of sightings across both bright and low-visibility conditions—hinting at either varying observer behavior or potential alien pattern preferences.
→ Are anomalies more likely to be detected in certain conditions?
→ Additional Questions: How many anomalies are being detected? Does region factor into anomaly spikes? Which country detects the most?
SELECT country,region, COUNT(*) AS anomaly_count
FROM `my-analysis.Alien_Encounters.Sightings`
WHERE anomaly_detected = TRUE #means yes, detection found
GROUP BY country, region
ORDER BY country, region;
#Queried to view the country/region for Anomalies detected!
Out of 4,000 total sightings, anomalies were detected in 1,979 cases, compared to 2,021 where no anomaly was reported—a near 50/50 split. Mexico leads the pack in anomaly detections, followed closely by Canada, Australia, and Brazil. Maybe the Southern Hemisphere really is tuned into the strange?
When analyzing the impact of weather on whether an anomaly was detected during a UFO sighting, Clear weather leads the way: Clear skies + Anomaly = 362 detections — the highest across all conditions. Stormy weather follows closely with 342 anomalies detected, showing that chaos in the sky doesn’t deter anomaly reports. Interestingly, Foggy conditions saw the fewest anomalies detected (304)—likely due to reduced visibility. What this shows us is that visibility matters: Clear conditions make it easier for observers (and perhaps some fancy sensors?) to detect strange patterns or phenomena. Stormy skies may enhance detection due to lightning, energy shifts, or electromagnetic disturbances. Despite assumptions, even Rainy and Snowy days produced a nearly even split between yes/no detections, suggesting weather alone doesn't suppress anomaly activity—it might just obscure it.
What about Regions? Across all countries, Central and West regions had the highest anomaly counts. Whether it’s dense populations, broad skies, or just weird vibes, those areas seem to attract the unexplained. If aliens are trying to be seen, that’s where they’re popping up.
So, what’s the main takeaway? Anomalies don’t play favorites. They show up day or night, in rain or shine, North or South—but if you're in the Central region of Mexico, under a clear sky, you might just have front row seats to the unexplained.
→ Which UFO encounters went viral, and what factors contributed to that?
→ What role did weather, country, witness count, and UFO type play?
Media coverage is rare—most alien encounters receive no attention at all. Only a small fraction go viral, suggesting the media is selective, favoring sightings that feel more mysterious, dramatic, or publicly witnessed. Which lets face it, the drama had to be giving right?
As for time, it matters showing viral sightings happening at night or dawn, times when the sky is dim and eerie. These conditions likely enhance the mystery, making the event more compelling for the public and shareable on social media.
Does the type of UFO matter? Every UFO type has had its moment in the spotlight, but “Unknown” UFOs—those that shapeshift or can’t be categorized—appear most often in viral reports. Familiar shapes like Disks and Lights also trend, likely because they’re easily recognized and filmed.
When looking globally, as someone based in the U.S., I was hoping for a front-row seat to the cosmic chaos—but surprise! The U.S. doesn’t lead in viral sightings. Instead, India, Australia, and Mexico take the top spots, proving that alien buzz crosses borders.
Taking witnesses into account is important, because with more witnesses = the more likely it goes viral. When more people see the same thing, it adds credibility, fuels conversation, and increases the chance that someone captures it on camera. Of course you have to look into weather to see if that changes viral-bility! One of the most unexpected findings? Foggy weather led to the highest number of viral sightings. The eerie, obscured visuals seem to enhance the mystery and intrigue, while clear skies actually had the fewest viral events.
My final thought, the media doesn’t just report on alien encounters—they amplify the most cinematic ones. High drama, mystery, and group validation seem to be the recipe for going viral in the world of UFOs.
→ What patterns emerge when analyzing by season or date range?
SELECT CASE
WHEN EXTRACT(MONTH FROM date) IN (3, 4, 5) THEN "Spring"
WHEN EXTRACT(MONTH FROM date) IN (6, 7, 8) THEN "Summer"
WHEN EXTRACT(MONTH FROM date) IN (9, 10, 11) THEN "Fall"
WHEN EXTRACT(MONTH FROM date) IN (12, 1, 2) THEN "Winter"
END AS season,
COUNT(*) AS encounter_count
FROM `my-first-project-2024-434615.Alien_Encounters.Sitings`
GROUP BY season
ORDER BY encounter_count DESC; #Query to understand Season Patterns
Season | Spring | Summer | Fall | Winter |
Encounter # | 1038 | 1001 | 995 | 966 |
Used SQL in BigQuery to understand Seasons. When analyzing alien encounters across time, a few subtle but telling patterns appear. Spring leads the year with the highest number of reported sightings (1,038), followed closely by Summer and Fall, while Winter trails slightly behind—perhaps the cold discourages both humans and extraterrestrials from venturing out.
On a weekly scale, Wednesdays and Saturdays emerge as the most active days, with 636 and 591 sightings respectively. Whether it’s a midweek spike in activity or a weekend window for cosmic exploration, those two days consistently top the chart. Which sorta matches us with Military and Government response being high on those weekdays too!
Month | December | November | October | September | August | July | June | May | April | March | February | January |
Encounter # | 334 | 304 | 337 | 354 | 358 | 333 | 310 | 335 | 359 | 344 | 281 | 351 |
Looking month-to-month, the data is pretty balanced, though April (359), August (358), and September (354) show slight upticks—potentially linked to seasonal shifts or increased sky-watching behavior. February, with just 281 sightings, had the fewest, possibly due to fewer days and less outdoor activity. Or perhaps the Aliens are enjoying some downtime with loved ones, if they are into that.
Year | 2025 | 2024 | 2023 | 2022 | 2021 | 2020 |
Encounter # | 301 | 812 | 782 | 837 | 785 | 483 |
Across years, 2022 saw the most activity (837 sightings), while 2020 had the least (483)—perhaps a result of global lockdowns and fewer people outdoors to witness strange lights in the sky. Notably, 2025 is currently on track to finish with the lowest count, but it’s still in progress. Who knows what the future will bring, but the Cosmic Curiosity Coalition is ready for any future chaos!
In short? Encounters happen year-round, but certain days and seasons may be more favorable—or at least more observable—than others. Whether it’s cosmic timing or human patterns, the aliens definitely seem to follow some kind of schedule.
Visualize the Data & Share
Thought Process for Visualization?
To bring the story to life, I chose to work with Tableau and Canva. Tableau allowed me to explore and present the data through charts, treemaps, bubble graphs, pie charts, heatmaps, and bar visuals. I then used Canva to craft a vibrant, animated slide deck—turning raw data into an engaging presentation.
Since the original dataset lacked a narrative, I had some fun by building a fictional framework: the Cosmic Curiosity Coalition, complete with titles for myself and Ian. This storyline added structure and personality to the analysis. Although the data is fictional, it was a creative challenge to present it with real-world analytical thinking. The CSV file included seven unique UFO types, and that’s where creativity truly kicked in—I wanted to visualize (using a mix of canva/chatGPT/editing) each aircraft or species, giving them identity and shape in a way that elevated the experience beyond spreadsheets.
Final Transmission Summary:
The Cosmic Curiosity Coalition set out to make sense of 4,000 interstellar sightings.
Here are the Key Takeaways from the Alien Analysis…
Top Hotspot: Canada had the most sightings, but Central regions across multiple countries hosted the highest concentration of encounters. East regions one the race overall in most encounters.
Military vs. Government Response: Nearly half of all sightings got military attention—but government classification was much more selective and sometimes oddly disconnected.
Light-type UFOs drew the most military interest, while Unknown forms were most likely to go viral.
Weather + Time: Stormy days and clear nights were prime conditions for sightings.
Foggy scenes? Perfect for viral fame.
Anomalies? They showed up almost evenly across all encounters—especially in Clear weather and Mexico’s Central region.
Viral Encounters: Driven by mystery, witnesses, and dramatic timing. Fog wins for eerie visuals, and India takes the lead globally.
Seasonal Patterns: Spring had the highest activity, while Wednesdays and Saturdays reigned supreme—maybe aliens like to stick to a loose schedule too.
Internal Memo from Kacie ScottLead Alien Analyst | Cosmic Curiosity Coalition (CCC)Subject: Beam Me Up, Data - An Alien Analysis CompleteWhether you believe in aliens or just love data that tells a story, one thing is clear: insights come alive when you pair logic with imagination. The universe is big, weird, and full of patterns waiting to be explored—so the next time you look up at the sky… just maybe, something’s looking back. Mission Complete Curator Ian. Analysis Logged. Ready for next contact.FINAL PROJECT:


Comments